Project methods.
Architecture, modeling decisions, validation, and business use across the projects in my portfolio.
Northstar Market Intelligence
An institutional-style Python platform for portfolio accountability, benchmark-relative analysis, cross-sector monitoring, and evidence-grounded market research.
Research and analytics architecture
- A service-oriented FastAPI backend separates market data, portfolio accounting, news, scorecards, chart generation, and retrieval so each layer can be tested independently.
- Python calculates total and annualized return, volatility, maximum drawdown, weekly-return distributions, concentration, cost basis, unrealized P&L, and benchmark-relative alpha.
- A curated 11-sector universe supports daily and weekly leader screens. The diversified top-five view selects one name per sector to reduce duplicate exposure while remaining explicitly framed as a research screen.
- Source-attributed news cards pair publisher identity with covered-security marks, using curated issuer, sponsor, and network domains plus readable monogram fallbacks when external icons are unavailable.
- The cited RAG workflow indexes normalized headlines in SQLite, uses OpenAI embeddings and Responses when configured, and retains a deterministic local retrieval and research-brief fallback.
- The interface records completed activity locally, models user-controlled weekly contributions, embeds TradingView, and exposes sources, assumptions, and backtesting limitations without connecting to a broker.
MLB Predictor
A transparent baseball probability and paper-trading system built around stable inputs, calibration, reproducible odds handling, and exportable decision logs.
Model architecture
- Elo ratings represent evolving team strength; Poisson scoring estimates run distributions; a roughly 19-feature logistic model adds matchup-level context.
- The ensemble converts model probability into edge by comparing it with market-implied probability. Kelly sizing is constrained by bankroll and user-selected risk settings.
- Online gradient descent supports incremental updates; batch logistic training, train/test evaluation, and five-fold cross-validation provide a separate quality check.
- Calibration is evaluated with Brier score, expected calibration error, sharpness, and ROC-AUC, not accuracy alone. Closing-line value and downloadable paper logs support forward monitoring.
Quant Desk
A research and operations layer for factor signals, risk-aware allocation, walk-forward evaluation, and paper-only portfolio monitoring.
Signal and portfolio workflow
- Cross-sectional features include 12-1 momentum, 200-day trend, inverse-volatility quality, RSI value sanity checks, and standardized composite scores.
- Portfolio construction uses inverse-volatility weighting, concentration caps, and a market-regime filter to translate scores into controlled exposures.
- Monthly walk-forward evaluation prevents future information from entering historical decisions. Information coefficient, turnover-aware costs, signal decay, and block-bootstrap Monte Carlo examine robustness.
- A machine-learning branch compares regularized logistic regression with histogram gradient boosting, using standardized inputs, ROC-AUC, permutation importance, and purged walk-forward splits with a one-month embargo.
StockLab
Three research notebooks spanning equity risk analytics, options pricing, and mechanical trade signals — each built to test its own conclusions against the benchmark most likely to disprove them.
Method and validation
- Equity analytics cover data-quality auditing, compounded versus arithmetic yearly returns, CAGR, Sharpe, Sortino, Calmar, VaR and CVaR, drawdown decomposition, and portfolio risk contribution that separates capital weight from risk weight.
- Direction modeling replaces in-sample scoring with expanding-window walk-forward validation benchmarked against the majority class. The resulting out-of-sample ROC-AUC below 0.50 is reported as the finding rather than tuned away.
- Options pricing implements Black–Scholes–Merton with all five Greeks, verified against put–call parity and central-difference numerical differentiation before any downstream use. Implied volatility is solved from bid–ask mid prices under liquidity screening.
- Volatility comparisons are horizon-matched. Aligning 30-day implied against 21-day realized moved the measured variance risk premium from +17.3% to +2.6% and reversed the trade conclusion it implied.
- The signal engine scores time-series momentum and trend as expanding percentiles of each name’s own history, guaranteeing point-in-time construction, then grades itself against buy-and-hold with transaction costs and threshold sensitivity.
PrimeKey Loan Operations Database
A relational data model for personal and small-business lending, covering the loan lifecycle from application through repayment, collateral, and collection outreach.
Model and implementation
- Ten normalized tables built around a supertype/subtype customer design, separating attributes shared by all customers from those specific to personal or business borrowers.
- Referential integrity is deliberate rather than uniform: subtype rows and loan-dependent records cascade on delete, while customers and loans are restricted, because loan history is the audit trail and must not be removable.
- Business rules are enforced in the schema rather than the application — non-negative balances, positive principal and payment amounts, maturity dates at or after effective dates, and constrained status enumerations — so they hold regardless of what writes to the database.
- Interest rates are versioned on loan type and effective date, so historical loans retain the rate in force when written instead of silently re-pricing when rates change.
- Ten analytical queries drove the design, covering loan exposure by type, borrowing concentration, approval rates, loan-to-value on collateralized lending, collection-channel effectiveness, and time-to-decision.
Residential Construction Project Plan
A scoped, scheduled, staffed, and costed build plan for a 2,500 sq ft single-family home against a fixed budget and deadline.
Planning method
- A thirteen-task responsibility assignment matrix (RACI) mapped across nine trade roles, structured so every work package carries exactly one responsible owner and a single approval gate — closing the two failure modes that most often break construction schedules: unowned tasks, and tasks where several parties each assume another has it.
- Resource leveling redistributed crew demand across the timeline to avoid both the delay cost of over-committing a trade and the waste of leaving one idle.
- Crew size was used as the control variable rather than a fixed input: reduced on tasks carrying schedule float to cut cost, increased on critical-path tasks to compress duration. That trade is what allowed both constraints to be satisfied simultaneously.
- Schedule compression was concentrated in the finishing phase — cabinets, appliances, landscaping, and final inspection — where dependency chains are loose, rather than in the strictly sequential foundation, framing, and roofing sequence.
Supply Chains 2030: Blockchain as Backbone
A future-state analysis of blockchain in global supply chains — the 2030 vision, its grounding in what already runs today, and the barriers most likely to stop it.
Analysis
- Works backward from a 2030 end state — digital product identity, smart-contract settlement of payments, customs and insurance, and transaction-level carbon accounting — testing each element against deployments that exist now rather than asserting the vision.
- Grounds the argument in live platforms (IBM Food Trust, VeChain, Ethereum, Polygon), interoperability layers (Polkadot, Cosmos), and the IoT-plus-oracle bridge that connects physical goods to on-chain records.
- Identifies regulation as the most likely accelerant rather than the technology itself, with the EU Digital Product Passport converting traceability from competitive advantage into legal requirement.
- Treats data integrity as the barrier with no clean technical fix: immutability guarantees a record was not altered, not that it was ever true, so every deployment depends on the trustworthiness of its sensor and oracle layer.
- Closes on the counterargument to its own thesis — if integration costs stay high, blockchain traceability becomes a compliance moat entrenching large incumbents rather than a transparency layer benefiting everyone.
HireSense
A retrieval-augmented candidate analysis prototype designed to connect résumé evidence to role requirements and structured interviews.
Pipeline
- Résumés are parsed and chunked into evidence units; embeddings place candidate evidence and role requirements in a shared vector space.
- Cosine similarity retrieves the most relevant evidence before language-model scoring, reducing the need to rely on an ungrounded full-document prompt.
- The interface surfaces explainable rankings and generates structured interview questions tied to retrieved evidence.
- Production use would require bias testing, consent, retention controls, human review, and documented adverse-impact monitoring. The prototype is decision support, not an autonomous hiring system.
Tractor Inventory Planning
A remote West Virginia University client-sponsored capstone, including a Columbus, Ohio site visit, focused on SKU-level safety-stock policy, service targets, and inventory return.
Decision framework
- ABC classification separates high-value, high-attention items from lower-value tail inventory so control effort matches economic exposure.
- Safety stock combines demand variability, replenishment lead time, and target service levels. Reorder points add expected lead-time demand to the buffer.
- Forecast quality is monitored with actual-versus-forecast error and MAPE, while bootstrap or Monte Carlo scenarios stress demand and lead-time uncertainty.
- Kristofor led a seven-person team developing the strategy for a 27-product portfolio, with 85-95% service-level targets and a reusable process map.
Surfside Surfboards
A MySQL operating model derived from original business rules for fixed board configurations, reusable components, customers, orders, reviews, and management reporting.
Data architecture
- The schema separates customers, boards, component definitions, fixed board/component relationships, orders, line items, reviews, and historical prices into eight normalized tables.
- Junction tables resolve many-to-many relationships; primary keys, foreign keys, uniqueness rules, checks, and timestamps protect referential and business integrity.
- Historical price snapshots keep order economics reproducible even when catalog prices change. Views simplify management reporting without duplicating source records.
- Quarterly SQL queries turn the operating model into customer, product, sales, and review insights. Docker setup makes the database reproducible.
Coffee Operations Modeling
A completed PySpark project analyzing approximately 1.96 million transaction records through two operational questions: wait-time prediction and rewards-membership classification.
Comparative modeling
- The wait-time track compares linear regression with decision-tree regression using held-out error and fit metrics; the nonlinear tree is selected when it better captures interactions in operational data.
- The membership track compares logistic regression with random forest classification. Logistic regression is selected for its balance of ROC-AUC performance and interpretability.
- PySpark ML pipelines support large-scale feature transformation and evaluation. Standardization and PCA are available for dimensionality and scale control.
- The notebook preserves outputs, but the original coffee dataset is not present; the repository reports that limitation directly.
U.S. Retail Job Openings Forecast
A 2025 monthly forecast built from 108 training observations spanning 2016-2024, with seasonal diagnostics and rolling-origin model comparison.
Forecast discipline
- ADF and KPSS tests assess stationarity from complementary null hypotheses; ACF, PACF, EACF, and STL decomposition guide seasonal structure and differencing decisions.
- Candidate models include multiple SARIMA specifications, damped ETS, STL plus ARIMA, a seasonal-naïve benchmark, and a weighted ensemble.
- Rolling-origin cross-validation with a 12-month horizon compares MAE, RMSE, and MAPE under the same forward-looking task as the final forecast.
- Ljung-Box residual checks test whether remaining errors behave like white noise. The final forecast covers January through December 2025.
Internet Service Churn
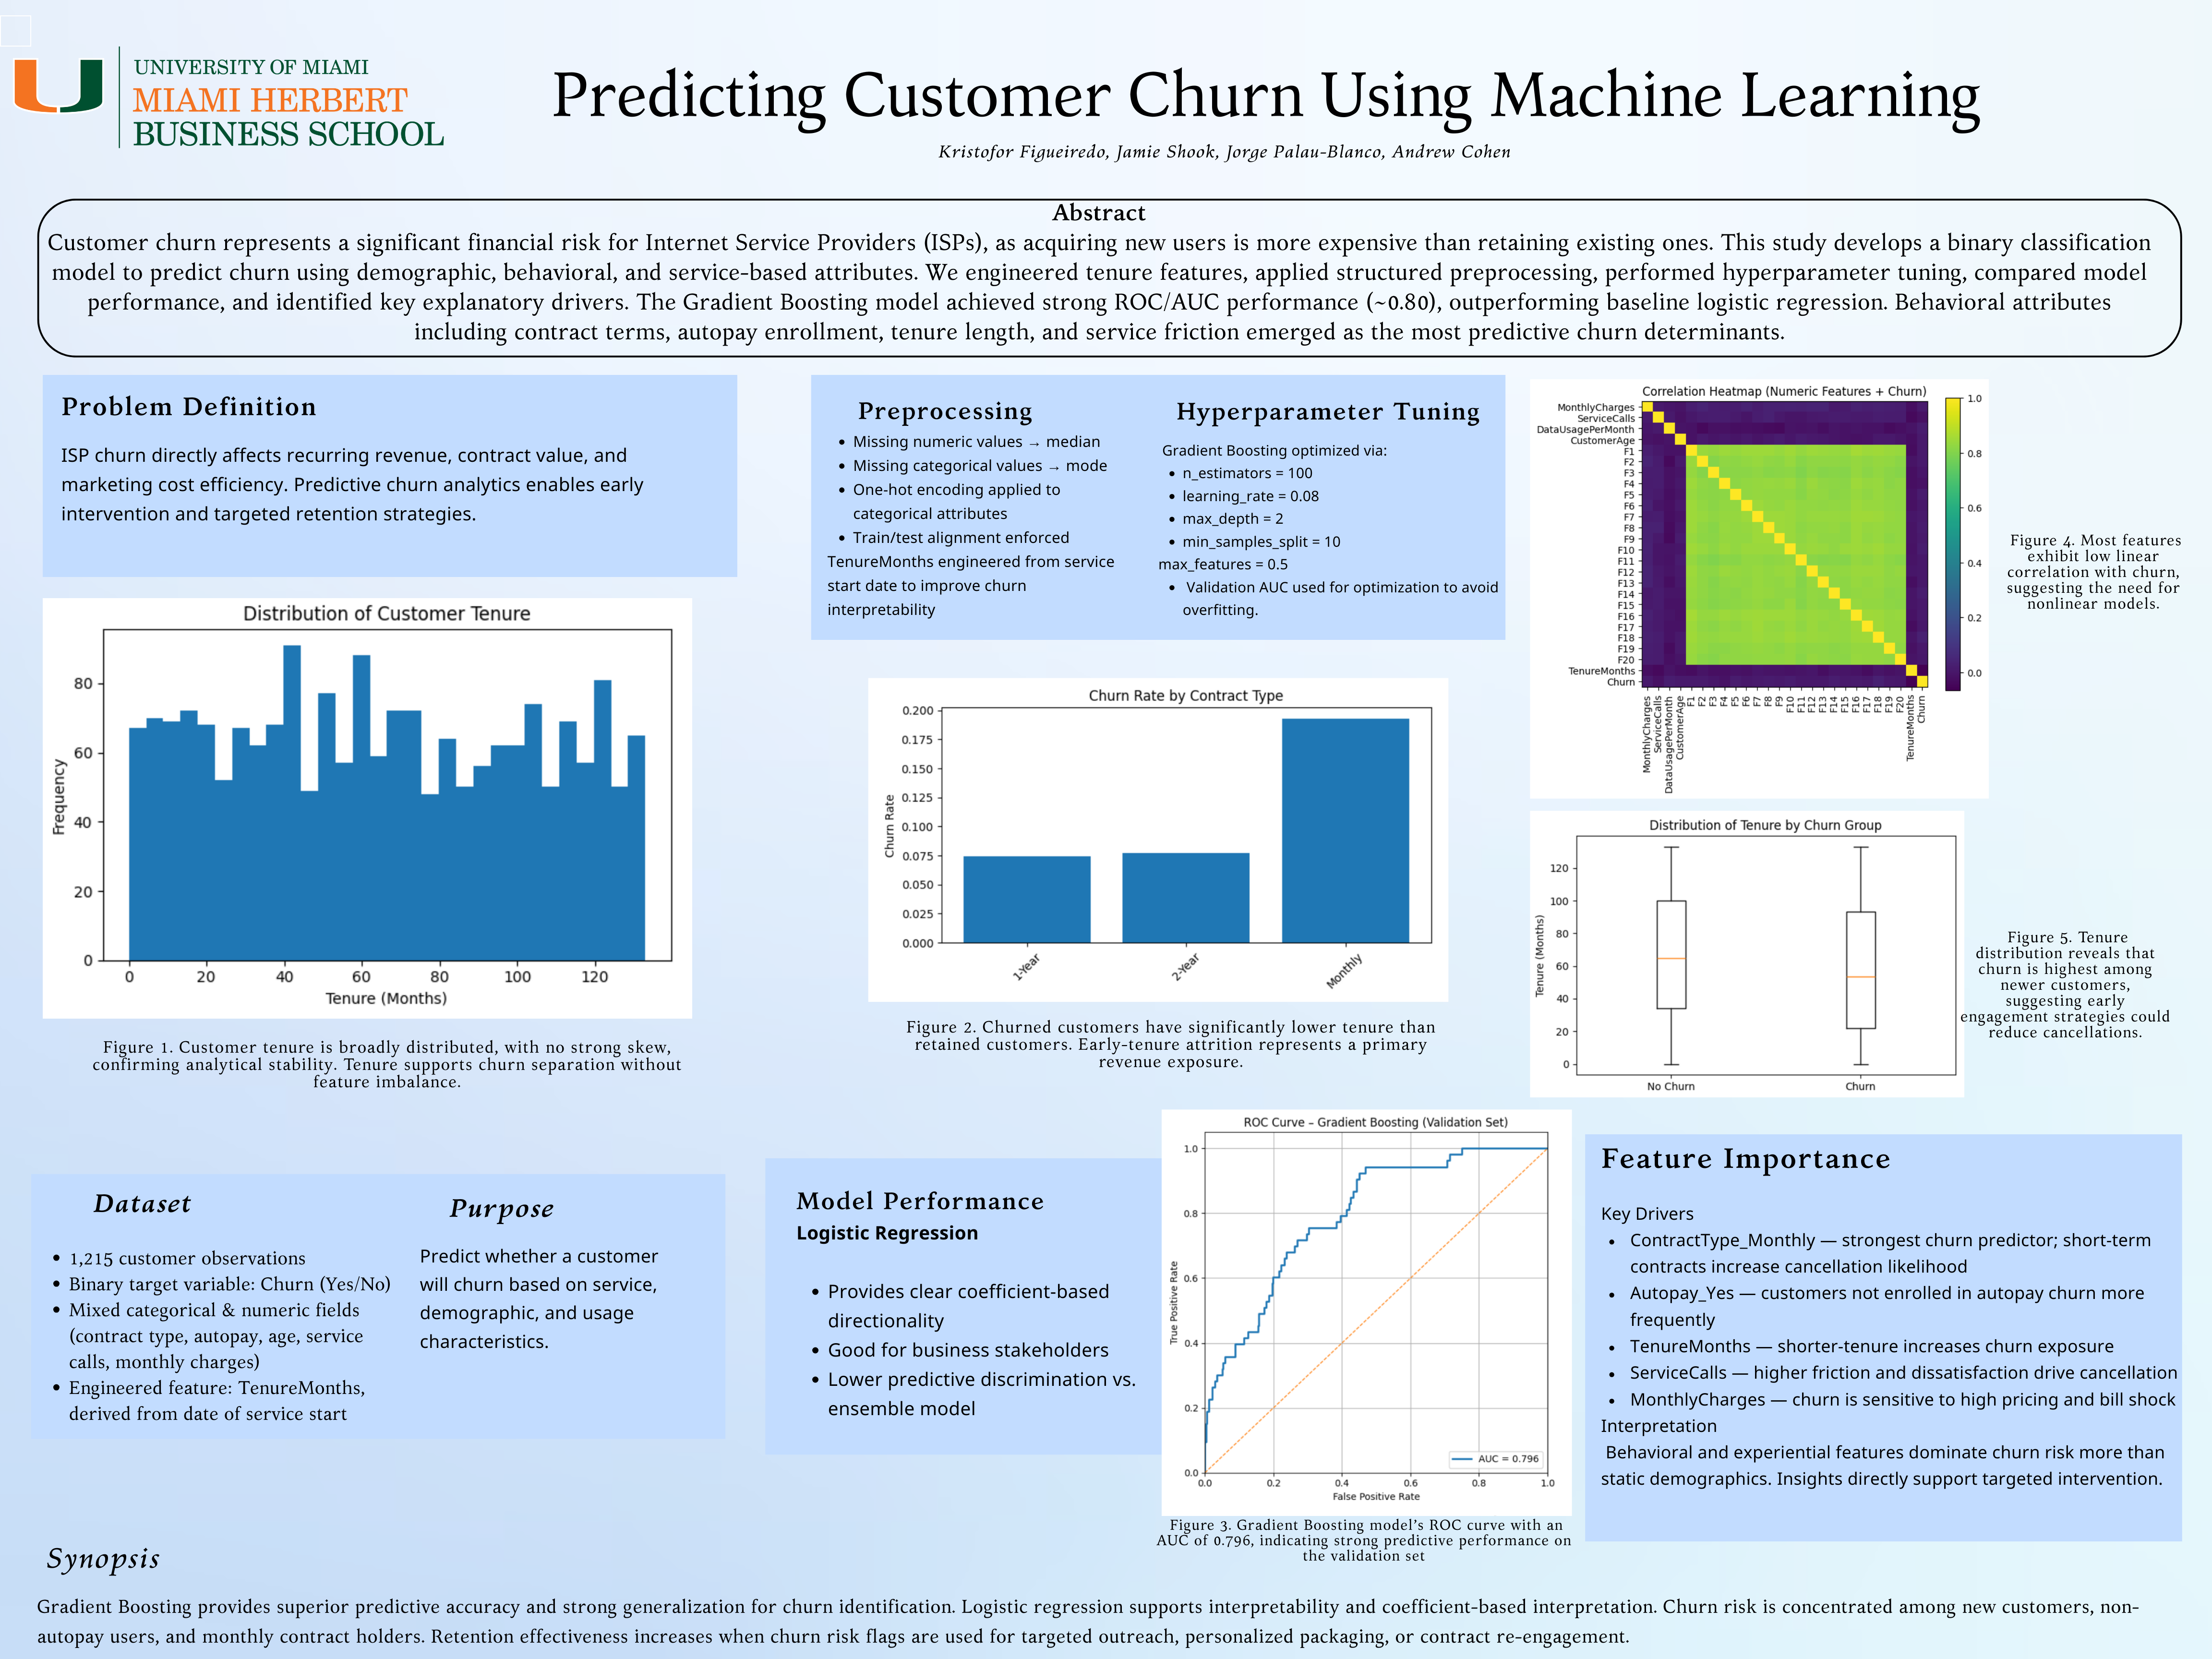
A team classification project focused on disciplined preprocessing, gradient boosting, model interpretation, and retention decision support.
Implementation
- Feature engineering converts tenure into months, followed by median and mode imputation for numeric and categorical fields.
- One-hot encoding and train/test column alignment prevent inconsistent feature matrices. A stratified holdout preserves the churn rate in validation.
- Gradient boosting captures nonlinear customer-risk patterns; the analysis pairs ROC-AUC with feature importance, ROC curves, and decision-threshold sensitivity.
- The final poster identifies monthly contracts, autopay enrollment, tenure, service calls, and monthly charges as the most useful drivers for retention strategy.
IT Asset Lifecycle & Risk
A City National Bank of Florida MSBA capstone contribution focused on lifecycle risk, legacy dependencies, KPI governance, and executive Power BI reporting.
Contribution and delivery
- Contributed to a cross-functional KPI audit across approximately 4,200 IT hardware assets in ServiceNow.
- Modeled lifecycle and end-of-life fields to identify at-risk units and surface legacy dependencies within internal systems.
- Supported a unified performance framework that standardized risk metrics and aligned reporting with strategic technology priorities.
- Built executive-ready Power BI reporting across four interactive pages with 19 custom DAX measures. The solution used DAX and CSS to meet a no-JavaScript security constraint.